You Asked: American, Malaysian, and South Korean Investor Migrant Trends
Following the publication of Which Nationalities Have The Greatest Propensity for RCBI Program Participation? earlier this week, a number of readers reached out requesting additional data on investor migrant trends for some of the nationalities mentioned.
A reader who works in CBI property development in the Caribbean asks:
I read your latest article and it is interesting to see that Malaysia and South Korea are so high on the list of countries from which people have a propensity to migrate. I checked your new data center but there is no info on [applicants from] Malaysia or South Korea. Do you have any info or stats to share on these countries? It would be worthwhile trying to figure out where they are migrating to so we can determine if they are markets worth targeting.
Worthwhile indeed.
Another reader, focusing on outbound investment migration from the United States, poses a similar question:
Awesome work on the new IMI Data Center. I have a question on the American market […] How do US main applicants break down by program?
Answers
Let me begin by clarifying that the investor migrant statistics upon which the “GDP-adjusted investment migration propensity” is based are limited and, though representative, capture only a minority of the true number of investment migration applications globally in a given year.
This is because only a minority of programs publish rich data. Though we continue to scour the internet for up-to-date statistics, file Freedom of Information requests to compel governments to hand over data, source unpublished-yet-official statistics on certain programs thanks to our global web of hundreds of informants, and manually translate Latvian PDFs, even IMI does not come close to having complete data sets. As a minor consolation, at least we come closer than anyone else.
Programs for which we have adequate data on applicant nationalities:
- Antigua & Barbuda CIP
- Australia BIIP (including SIV)
- Saint Lucia CIP
- US EB-5
- US E2
- Greece Golden Visa
- UK Tier 1 (investors, entrepreneur, startup, innovator)
- Vanuatu DSP
- Latvia Golden Visa
Programs for which we have limited or incomplete data on applicant nationalities (typically programs where only the top five or ten applicant nationalities are reported):
- Irish Investor Immigration Program
- Malaysia MM2H
- New Zealand Investor Visa
- Portugal Golden Visa
- Spain Golden Visa
- Thai Elite Visa
- Turkey CIP
Programs where we have hardly any nationality data whatsoever:
- Cayman Islands residency by investment
- Cyprus CIP
- Dominica CIP
- Grenada CIP
- Malta IIP
- Malta RVP
- Panama residency by investment
- Quebec IIP
- Saint Kitts & Nevis CIP
Due to such limitations, when we calculated investment migration propensity, we made sure to compare apples-to-apples, which is to say that we compared the investor migrant trends of different nationalities by considering only those programs for which we had sufficient data on all the nationalities under analysis.

So far, in the IMI Data Center’s Country Market section, we have published investor migrant trends for the period 2015-2019 for the following 11 markets:
- Bangladeshi Market
- Chinese Market
- Egyptian Market
- Filipino Market
- Indian Market
- Kenyan Market
- Nigerian Market
- Pakistani Market
- South African Market
- Turkish Market
- Vietnamese Market
Today, we will oblige the readers who raised the above questions by publishing investor migrant trend data on Americans, Malaysians, and South Koreans. In a slight departure from convention, we will not do an apples-to-apples comparison; rather, we will report all the data we have for each of the three nationalities, irrespective of whether such data exists for all of them. Where nationality data from a particular program exists for at least one of the nationalities but not the others, we have included a “missing data” marker.
Note that for the US programs (EB-5 and E2), main applicant and dependent statistics are not reported separately. We have therefore assumed an average family size of 3 to arrive at an estimate of the number of main applicants.
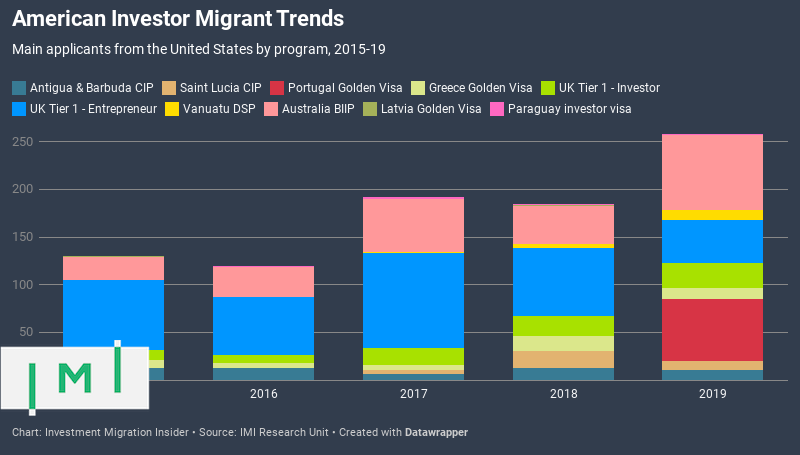
Americans
| 2015 | 2016 | 2017 | 2018 | 2019 | |
|---|---|---|---|---|---|
| Antigua & Barbuda CIP | 13 | 13 | 6 | 13 | 11 |
| Saint Lucia CIP | 0 | 0 | 4 | 17 | 9 |
| Portugal Golden Visa | Missing data | Missing data | Missing data | Missing data | 65 |
| Greece Golden Visa | 8 | 5 | 6 | 16 | 12 |
| United States EB-5* | N/A | N/A | N/A | N/A | N/A |
| United States E2* | N/A | N/A | N/A | N/A | N/A |
| UK Tier 1 – Investor | 11 | 8 | 18 | 21 | 26 |
| UK Tier 1 – Entrepreneur | 73 | 61 | 99 | 72 | 45 |
| Vanuatu DSP | 0 | 0 | 1 | 4 | 10 |
| Malaysia M2H | Missing data | Missing data | Missing data | Missing data | Missing data |
| Australia BIIP | 24 | 32 | 56 | 40 | 79 |
| Latvia Golden Visa | 1 | 0 | 0 | 1 | 0 |
| Paraguay investor visa | 0 | 1 | 2 | 1 | 1 |
Malaysians
| 2015 | 2016 | 2017 | 2018 | 2019 | |
|---|---|---|---|---|---|
| Antigua & Barbuda CIP | 0 | 0 | 0 | 0 | 1 |
| Saint Lucia CIP | 1 | 1 | 0 | ||
| Portugal Golden Visa | Missing data | Missing data | Missing data | Missing data | Missing data |
| Greece Golden Visa | 0 | 0 | 0 | 0 | 2 |
| United States EB-5* | 16 | 4 | 3 | 19 | 5 |
| United States E2* | 2 | 3 | 2 | 2 | 2 |
| UK Tier 1 – Investor | 4 | 3 | 6 | 2 | 1 |
| UK Tier 1 – Entrepreneur | 14 | 22 | 19 | 15 | 13 |
| Vanuatu DSP | 1 | 4 | 5 | ||
| Malaysia M2H | N/A | N/A | N/A | N/A | N/A |
| Australia BIIP | 244 | 442 | 468 | 344 | 211 |
| Latvia Golden Visa | 0 | 0 | 0 | 0 | 0 |
| Paraguay investor visa | 0 | 0 | 0 | 0 | 0 |
South Koreans
| 2015 | 2016 | 2017 | 2018 | 2019 | |
|---|---|---|---|---|---|
| Antigua & Barbuda CIP | 2 | 1 | 1 | 1 | 0 |
| Saint Lucia CIP | 0 | 4 | 9 | ||
| Portugal Golden Visa | Missing Data | Missing Data | Missing Data | Missing Data | Missing Data |
| Greece Golden Visa | 0 | 1 | 0 | 1 | 1 |
| United States EB-5* | 30 | 87 | 65 | 177 | 232 |
| United States E2* | 712 | 673 | 709 | 787 | 851 |
| UK Tier 1 – Investor | 21 | 29 | 27 | 13 | 5 |
| UK Tier 1 – Entrepreneur | 33 | 29 | 27 | 23 | 12 |
| Vanuatu DSP | 0 | 5 | 21 | ||
| Malaysia M2H | 120 | 184 | 693 | 449 | Missing data |
| Australia BIIP | Missing data | Missing data | Missing data | Missing data | Missing data |
| Latvia Golden Visa | 0 | 0 | 0 | 0 | 0 |
| Paraguay investor visa | 0 | 0 | 0 | 0 | 0 |
The real numbers are much greater
Keep in mind, when reading the above statistics, that they represent only a fraction of the actual number of investor migrants from the US, Malaysia, and South Korea in the last five years. These are just the ones we know about, thanks to those governments that publish the data.
Many of the most popular programs – such as the CIPs of Saint Kitts & Nevis, Dominica, Malta, Cyprus, Grenada, Turkey, the golden visas of Spain, Thailand, New Zealand, and so on – are not represented in the above statistics, but collectively account for tens of thousands of applications annually. We know this because although they don’t publish detailed nationality data, many of them publish aggregate application and approval figures.
This means that the true volumes of investor migrants of any given nationality may, in some cases, be an order of magnitude greater than what’s observable.

Christian Henrik Nesheim is the founder and editor of Investment Migration Insider, the #1 magazine – online or offline – for residency and citizenship by investment. He is an internationally recognized expert, speaker, documentary producer, and writer on the subject of investment migration, whose work is cited in the Economist, Bloomberg, Fortune, Forbes, Newsweek, and Business Insider. Norwegian by birth, Christian has spent the last 16 years in the United States, China, Spain, and Portugal.