Which Nationalities Have The Greatest Propensity for RCBI Program Participation?
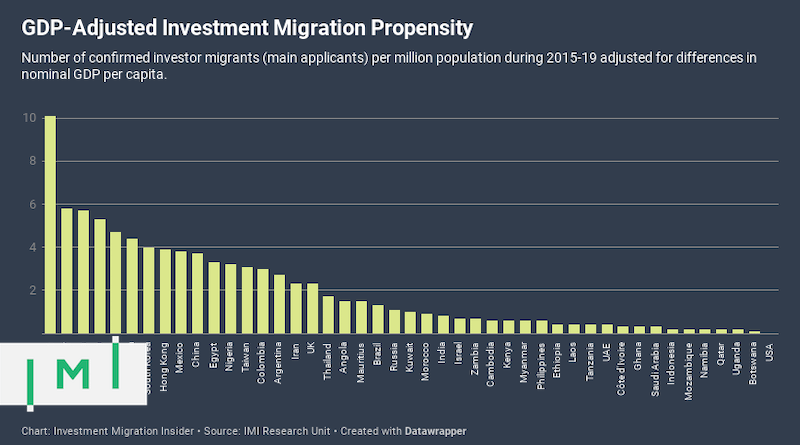
While Hongkongers are more likely than any other nationality to participate in investment migration programs, the Vietnamese are the most RCBI-inclined population when differences in wealth are taken into account.
Here’s how we measure the investment migration propensity of the biggest RCBI markets:
Absolute vs. GDP-adjusted investment migration propensity
Past performance, says an old aphorism, is the best predictor of future results. For each market considered in the 2020 Investment Migration Market Eligibility Index© (IMMEI), therefore, we have counted the number of known RCBI-applications recorded in each year for the period 2015-19 (main applicants only). This figure is then expressed as a per-million-population number, which we call “absolute investment migration propensity”.
For example, a country with a population of 10 million that was the source of 1,000 RCBI cases in the last five years would have an absolute investment migration propensity of exactly 100 (1,000/10). This number tells us a great deal about how inclined a market’s population is to participate in investment migration programs.
To know more precisely how predisposed a population is to participating in RCBI programs relative to populations of other markets, however, we need to modulate the absolute investment migration propensity by adjusting for differences in purchasing power. We’ll illustrate why this adjustment is necessary with another hypothetical example:
Country A and Country B both have a population of 10 million and both have been the source of precisely 1,000 RCBI-cases in the last five years. But the GDP per capita of Country A is double that of Country B. Though in absolute terms, these two markets’ RCBI propensity is equal, the population of Country B has demonstrated significantly higher interest in RCBI because, even though they have only half the purchasing power of Country A, they are the source of the same number of applications.
To get a clearer picture of the relative demand for RCBI products, we therefore adjust for differences in GDP per capita to obtain what we call the “GDP-adjusted investment migration propensity”. With the same population, the same number of RCBI cases, but half the GDP per capita, Country B’s GDP-adjusted RCBI propensity is double that of Country A.
To arrive at a GDP-adjusted propensity number, therefore, we simply divide the absolute propensity by the nominal GDP per capita and then multiply by 1,000.
Vietnam and Hong Kong
Here’s a real-world example of how we arrive at the GDP-adjusted investment propensity for two countries, Hong Kong and Vietnam, which make for a highly illustrative example.
At 190.1 investor migrants per million population in the last five years, Hong Kong has the highest absolute investment migration propensity of any country surveyed. Vietnam, meanwhile, was the source of 27.4 investor migrants per million population.
On the face of it, Hongkongers are seven times more interested in investment migration than the Vietnamese. But that simplistic arithmetic belies a veritable Vietnamese obsession with investment migration because of the large disparity in incomes between the two countries. While Vietnam’s (nominal) GDP per capita in 2019 was US$2,715, that of Hong Kong was US$48,713, or roughly 18 times greater. Pound for pound, therefore, the Vietnamese are far more given to investment migration than Hongkongers.

To see precisely by how much, we’ll adjust for differences in GDP per capita between the two:
Hong Kong GDP-adjusted propensity = (absolute propensity/GDP per capita)*1,000 = (190.1/48,713)*1,000 = 3.9
Vietnam GDP-adjusted propensity = (absolute propensity/GDP per capita)*1,000 = (27.4/2,715)*1000 = 10.1
Seen in this light, we can conclude that the Vietnamese are actually 156% more inclined than Hongkongers to participate in an RCBI program.
Why is GDP-adjusted investment migration propensity an important metric?
What GDP-adjusted investment migration propensity gives us an indication of is how many investor migrants per million a country would have if more of its citizens could afford it. And this number can help RCBI executives the world over predict where demand will come from tomorrow.
It’s an imperfect and inaccurate measure, of course, because as GDP per capita rises in a country, the factors motivating emigration may also recede in lockstep with improved economic conditions. Then again, they may not; Hong Kong has one of the world’s highest GDPs per capita and they are still very likely to emigrate, although for different reasons than the Vietnamese.
But, ceteris paribus, or all other factors remaining constant, should Vietnam reach Hong Kong’s GDP per capita at some point in the future, its absolute number of investor migrants per million would likely be a great deal higher than that of Hong Kong.
If you like data-driven articles like this one, you’ll love the IMI Data Center, the world’s largest collection of investment migration statistics, with more than 350 graphs and charts on dozens of IM programs and markets.

Christian Henrik Nesheim is the founder and editor of Investment Migration Insider, the #1 magazine – online or offline – for residency and citizenship by investment. He is an internationally recognized expert, speaker, documentary producer, and writer on the subject of investment migration, whose work is cited in the Economist, Bloomberg, Fortune, Forbes, Newsweek, and Business Insider. Norwegian by birth, Christian has spent the last 16 years in the United States, China, Spain, and Portugal.