The Investment Migration Market Eligibility Index and The 10 Most Eligible RCBI Markets Report 2020
Today, the IMI Research Unit has the pleasure of introducing the Investment Migration Market Eligibility Index© (IMMEI) and the accompanying report, The 10 Most Eligible RCBI Markets 2020, two tools several months in the making.
All active IMI Club members can access the IMMEI here.
What is the Investment Migration Market Eligibility Index and what does it measure?
In brief, the IMMEI is a tool that helps RCBI executives decide on which markets to concentrate their time and resources by indicating which markets are relatively more attractive.
The IMMEI relies on purely quantitative data to rank potential investment migration markets according to their relative suitability as targets of RCBI-firm investment and marketing. We created the IMMEI in response to investment migration executives’ repeated inquiries as to which RCBI markets globally showed the most promise and which, consequently, should be the focus of their time, resources, and company expansion plans.
Implicit in such inquiries are the recognitions that some markets are inherently more deserving of a company’s attention than others and that the relative attractiveness of a market is somehow measurable.
Those recognitions, subsequently, give rise to two principal questions:
- Which attributes make an RCBI market attractive?
- How can we objectively measure those attributes?
To determine which markets are the most attractive, it’s necessary to answer both questions, in order.
Which attributes make an RCBI market eligible?
We have identified five main attributes of RCBI-market eligibility and 15 submetrics by which to quantitatively measure them. Before outlining how each metric is measured, consider the five main attributes that make an RCBI market attractive:
High demand for RCBI
A fundamental and necessary (but not, in itself, sufficient) attribute of an attractive RCBI-market is that individuals within that market display – to a meaningful extent – demand for RCBI products and services. People must want what you’re selling, which in this case is residency and citizenship by investment products or advisory services. Markets in which only a tiny proportion of the population want these products and services (such as, say, Denmark) may therefore be discarded right from the start.
A large client pool
A significant share of a market’s population wanting to participate in RCBI programs (demand) is not, as mentioned, in itself enough to make a market attractive; for demand to be effective, it must be coupled with purchasing power. Since RCBI programs are big-ticket products with a high capital barrier, the market’s level of purchasing power must be considerable, which effectively means there must be a large number of wealthy people in that market. The Sudanese, for example, are almost universally interested in migration but, equally invariably, haven’t the means to realize such ambitions.
Room for future growth (“Macro-Potential”)
Because establishing a presence in a new investment migration market consumes time and resources, RCBI executives attempt to forecast a market’s future growth potential. The most attractive markets today may be displaced by others tomorrow. Some markets may be worth entering early in order to gain a competitive foothold and an early-stage market share.
Accessibility
Some of the most attractive markets in terms of demand, client pool size, and macro-potential also have some of the highest barriers to entry. They may have prohibitively byzantine regulations, restrictions on foreign ownership, require high startup- and operational costs, or offer insufficient human resources locally. All else being equal, markets that are easy and cheap to access are more attractive.
Current RCBI competition
As a rule, it is better to have fewer competitors than more. Markets in which few RCBI-specialists are present will, therefore, be more attractive than those with many, other factors remaining constant.
How do we objectively measure each of those attributes?
In the IMMEI, we have relied on purely quantitative data to measure a market’s eligibility for RCBI-firm consideration. We have emphasized the quantitative because it improves the objectivity (and, by extension, the reliability) of our measurements.
One subjective element that we are unable to eliminate, however, is the weight we have accorded to each of our objective measurements. To mitigate that subjectivity, we outline clearly the precise weight we have given each measure so that readers may themselves heighten or lower the weight of any individual criterion according to their own judgement, which will – in any case – vary between companies depending on their company’s idiosyncratic conditions.
To see a complete and detailed description of our methodology, including which specific data sources were used and how they were weighted, please visit the IMMEI page.

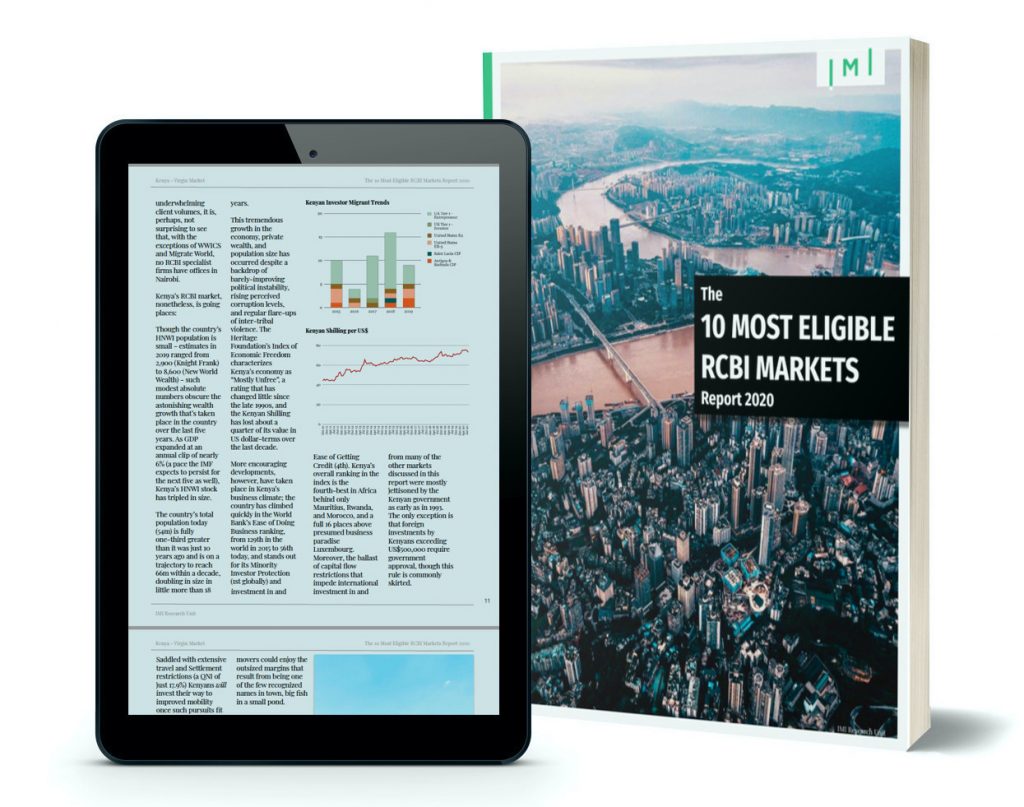
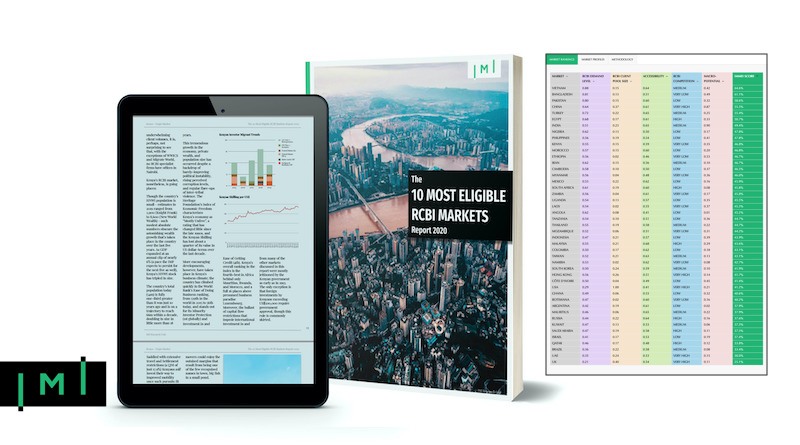
This report is a detail-rich discussion on each of the world’s ten highest-ranked RCBI markets according to the findings of the Investment Migration Market Eligibility Index© (IMMEI).
The IMMEI and this accompanying report were created in response to investment migration executives’ repeated inquiries as to which RCBI markets globally show the most promise and which, consequently, should be the focus of their time, resources, and company expansion plans.
The 10 Most Eligible RCBI Markets
Report 2020
The report contains a wealth of data on each of the ten most eligible markets, and the essential information necessary for investment migration executives to make informed choices as to which markets to target, such as:
- RCBI participation statistics
- The number of approved applications for every major investment migration program from each market, for every year in the period 2015-19. Find out which types of programs (RBI vs. CBI vs. SUV) are the most popular among particular nationalities.
- The number of approved applications for every major investment migration program from each market, for every year in the period 2015-19. Find out which types of programs (RBI vs. CBI vs. SUV) are the most popular among particular nationalities.
- HNWI population estimates and forecasts
- How many HNWI live in each market now, and by how much is the HNWI population expected to grow over the next five years.
- How many HNWI live in each market now, and by how much is the HNWI population expected to grow over the next five years.
- RCBI company competition analysis
- Which RCBI companies have offices in which markets? How many RCBI companies does each market have? Which RCBI companies are dominant in each market? The report contains a database of more than 100 RCBI-firm offices in the top 10 markets.
- Which RCBI companies have offices in which markets? How many RCBI companies does each market have? Which RCBI companies are dominant in each market? The report contains a database of more than 100 RCBI-firm offices in the top 10 markets.
- Legal, regulatory, and political
- See which countries impose capital controls, restrictions on dual citizenship, or limits on foreign ownership. Compare the performance of each market’s currency over the last decade.
- See which countries impose capital controls, restrictions on dual citizenship, or limits on foreign ownership. Compare the performance of each market’s currency over the last decade.
- Accessibility
- How cheap or expensive would it be to expand into a particular market? How hard is it to find qualified local personnel?Compare markets on cost of living, the price of Grade A office space, talent pools, and salary expectations.
- How cheap or expensive would it be to expand into a particular market? How hard is it to find qualified local personnel?Compare markets on cost of living, the price of Grade A office space, talent pools, and salary expectations.
- Long-term market potential
- Compare countries on how fast their economies and populations have grown in the last five years and at what pace they are forecast to grow over the next five.
IMI Club Pro Members:
FREE
IMI Club Members on annual billing plan (50% discount):
€249
IMI Club Members on monthly billing plan (25% discount):
€375
SPECIAL OFFER
1 year of IMI Club Membership +
the Report:
€299 (save 52%)
Non-Members:
€499


