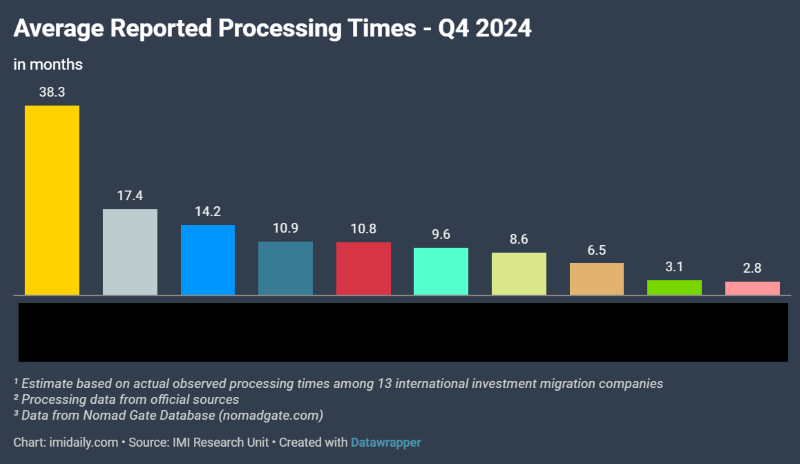
In Q2 of this year, we launched the Investment Migration Processing Time Data tool for our IMI Pro members. Last quarter, all but one of the ten investment migration programs we track have registered increased processing times; Q4’s results are more mixed.
Two of three golden visa programs have reduced their processing times – one achieving a 13% improvement – while one program has slowed down.
Five Citizenship by Investment (CBI) programs have shortened their timelines, though two others have registered increases.

The data indicate broad improvements across most programs. The fastest golden visa program now completes applications in 2.8 months.
The fastest CBI program has cut its average processing time to 3.1 months, a 16% reduction from Q3’s 3.7 months.
Processing times for the slowest program in the index had increased by 6% since Q3, now requiring 38.3 months to complete applications.
Caribbean CBI programs exhibit notable variance in processing speeds. While the regional average remains above ten months, average processing times range from 6.5 months for the fastest program to 14.2 months for the slowest.
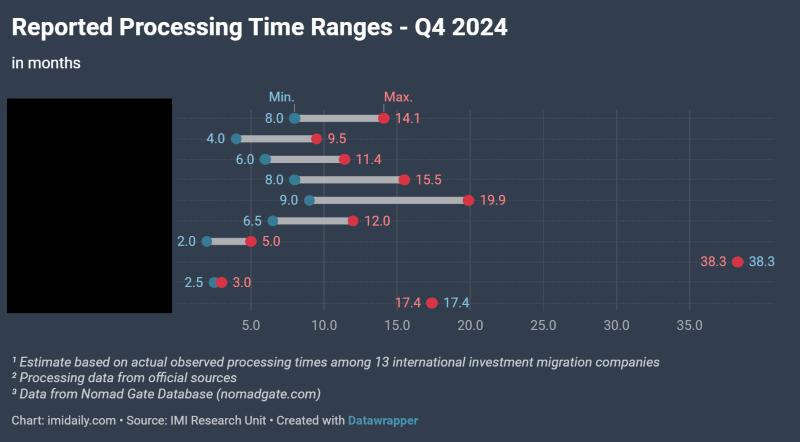
Some agents had reported processing times extended to 20 months for one Caribbean CBI program.
The minimum reported processing time for a CBI program stands at two months.
IMI Pro members can review the historical and Q3-updated data sets here. Still not an IMI Pro member? Sign up here.

How we gather the data for the investment migration program processing times:
IMI gathers processing-time data in three different ways:
1. From official sources
This is only feasible in a minority of cases because most program authorities don’t publish regular processing time updates. In our Q2 2024 dataset, the only processing data that come from official sources are those of the golden visa of Greece, where authorities publish detailed application and approval data on a monthly basis.
2. Empirical observations by practitioners
Most of the data in our overview comes from real-time updates from investment migration companies. IMI contacts 4-10 providers for each program and obtains from them the total processing time for their most recently approved application for each program.
We then calculate a processing time estimate based on the average of the responses. We also provide the range of responses for each program. For example, for the Antigua & Barbuda CIP, seven investment migration firms in Q2 2024 reported processing times ranging from 5 to 13 months, and 7.6 months on average.
3. From third-party databases
The most accurate source of data is official statistics because it encompasses all applications filed. But this data is typically not available. Empirical data from practitioners is a decent but imprecise proxy for official data because the sample size is relatively small. Third-party databases, however, represent a middle-ground: It doesn’t comprise all applications, but the sample size is larger than what can be collected empirically from service providers.
In the case of the Portugal golden visa, where official data is not available, we have relied on the next-best source of data: Nomad Gate’s crowdsourced application timeline data, which contains the self-reported processing times of nearly 700 golden visa applications and is continuously updated.