43,286 E2 Visas Issued in FY2019: Canadian Participation Up 60% Under Trump
Fiscal year 2019 was the American E2 visa program’s third-best year on record; 43,286 individuals – citizens of one of the 83 E2 Treaty signatory countries – received long-term, non-immigrant visas in the United States through the scheme.
Of these, nearly a third came from Japan alone. No other country comes close to Japan’s 13,664 E2 visa recipients; the country accounted for more visas than the rest of the top-5 countries (Canada, UK, Germany, and France) combined.
Presuming an average family size of three and capital investment of US$250,000, the program will have raised in excess of US$3.6 billion in 2019.
Historical E2 visa approval data reveal a number of noteworthy trends with regards to where applicants come from, which origin countries are trending upwards, and which are providing fewer than they did in the past.
Over the 12-year period between FY2008 and FY2019, Asians and Europeans accounted for 82% of all E2 visas:
- Asia: 181,122
- Europe: 166,343
- South America: 137,22
- North America: 56,814
- Oceania: 4,620
- Africa: 1,311
Though the source of a mere 0.3% of visas during the 2008-19 period, Africa (where only 8 out of 54 countries are E2 Treaty signatories) has seen the highest recorded compound annual growth rate – 9.24% – followed by South America at 8.54%, and North America (which includes, essentially, anything from Panama and up) at about 7%. On a continental scale, Asia has grown the most slowly, at a CAGR of just 2.35% in the period.
As is often the case in statistical analysis, however, we find that within-group differences are greater than between-group differences. Asia’s sluggish aggregate growth is explained chiefly by the decline in South Korean applicants.
Inversely, while most African countries have seen low or negative growth in applications over the 12-year period, a strong showing from Egypt – which accounts for more than 6 in 10 African E2 applicants – is what’s pulling the average upwards.
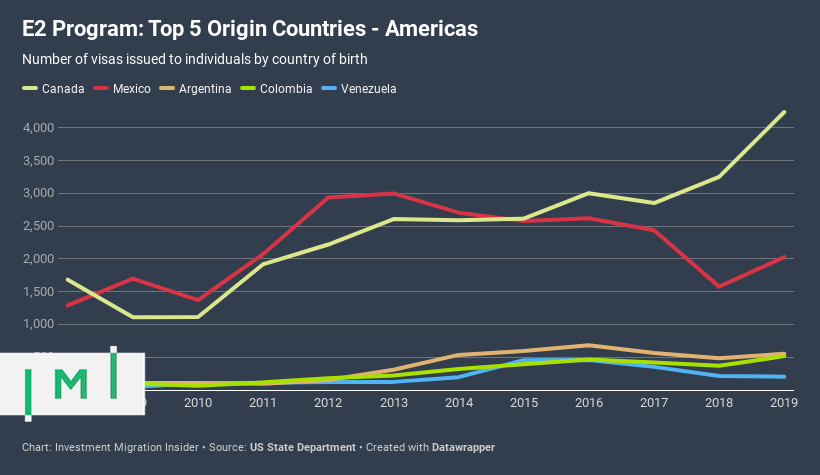
Whether correlated or not, President Trump’s first term in office has, somewhat ironically, coincided with a sharp rise in Canadian entrepreneurs setting up in the US; on average, the number of E2 visa approvals for Canadians has been 60% higher during the Trump-years than under Obama, and Canadian applications are trending strongly upward. It’s another story among Mexicans.
Applications from Germany, meanwhile, are in their fourth straight year of decline and have, so far, dropped 30% since its 2016 peak. The other four large European countries have remained on a steady upward trajectory.
Christian Henrik Nesheim is the founder and editor of Investment Migration Insider, the #1 magazine – online or offline – for residency and citizenship by investment. He is an internationally recognized expert, speaker, documentary producer, and writer on the subject of investment migration, whose work is cited in the Economist, Bloomberg, Fortune, Forbes, Newsweek, and Business Insider. Norwegian by birth, Christian has spent the last 16 years in the United States, China, Spain, and Portugal.


