
When IMI built its Global Property Scoreboard (GPS), it built a tool that evaluates the long-term attractiveness of cities for residential real estate investment from the perspective of global investors. As of September 2026 it ranks 150 cities.
The question it asks is how attractive a city is as a long-term property investment market for a foreign investor, weighing return potential, access, friction, resilience, and structural demand.
One result cut against the idea that Nordic property is a single block of expensive, high-tax, low-yield markets. Helsinki took the top spot worldwide, ahead of Lima and Abu Dhabi.
The other four Nordic capitals landed well behind. Stockholm ranks 16th, Reykjavik 56th, Oslo 78th, and Copenhagen 82nd.
Five capitals, one region, near-identical institutions, and a spread reaching from the top of the board down to 82nd. The reasons they diverge are not the ones most buyers fixate on.

What the Scoreboard measures
GPS scores each city across 42 fundamentals grouped into seven sections, weighting property at 30%, demand at 20%, and access, costs, governance, resilience, and macro conditions at 10% each.
The framework favors markets a foreign investor can realistically buy into, finance, own, and exit. Markets closed to foreign buyers fall outside the ranking, 17 of them as of September 2026, and restricted markets take a Foreign Ownership Limitations Penalty scaled to how hard they are to enter.

That penalty bites harder in the Nordics than in most regions, because two of the five capitals limit foreign buyers by law.
Governance is the Nordic baseline
Each of the five capitals scores well on the things a foreign buyer checks before anything else, rule of law, control of corruption, judicial effectiveness, and property rights. Stockholm and Copenhagen top the governance section outright, Helsinki follows close behind, and Reykjavik and Oslo trail by three points.
None of the five offers a light capital gains regime, and gross yields across the region are thin. Reykjavik leads the five at 4.88% as of the second quarter of 2026, though by a narrow margin over Stockholm.
Institutional quality is near enough fixed across the five. The ranking then turns on the point in each price cycle, the openness to foreign capital, and the demographic demand behind the market.
Helsinki leads on all three, and it does so despite the weakest cost score of the five, which makes its position at the top more striking rather than less.

Helsinki, a market deep into its correction
Helsinki tops the global board because it pairs Nordic institutional quality with a low entry point. Finnish house prices fell hard after 2022, when rising Euribor rates hit a mortgage market where 95% of the housing loan stock is linked to Euribor, and passed those increases straight through to borrowers.
Prices fell more than 10% from the 2022 peak nationally, with variation across Helsinki submarkets, and the fall has not finished. Statistics Finland recorded old dwelling prices down 3.9 percent year on year in the second quarter of 2026, with the quarterly move flattening to 0.1 percent.
GPS flags a market that has revised rather than inflated by pairing time since the price nadir with ten-year price restraint, and Helsinki scores well on both counts.
Access is straightforward for the apartments that make up most of the market. Finnish apartments are owned through housing companies, and a foreign national can buy shares in those companies without a permit, so an overseas investor transacts on the same terms as a local.
Non-EU and non-EEA buyers of real estate do need a permit from the Finnish Ministry of Defence, but that requirement does not touch housing company shares, which is how the urban apartment market trades. Since July 2025 the ministry can also refuse buyers from Russia and Belarus.
The euro removes the currency risk that weighs on the region’s floating-rate markets.
The drawbacks are worth weighing. Gross yields are thin, 2.97% in the city center by Numbeo’s measure and 4.52% across the wider market, while rental income and capital gains face rates of 30 to 34 percent on top of an annual property tax.
Foreign buyers also need to understand the ownership structure. Most apartments come through a housing company (asunto-osakeyhtiö), in which the buyer owns tradeable shares that confer the right to occupy a specific unit rather than direct title to the land and building.
The structure is legally sound and bankable, and it brings building-level liabilities that demand close due diligence. Major pipe renovations (linjasaneeraus) in older blocks cost well over a thousand euros per square meter, and half as much again in the capital region.
On a typical Helsinki flat that reaches tens of thousands of euros, enough to erase several years of net income if it falls due soon after purchase.
Helsinki is an appreciation and quality play rather than an income play. For a foreign investor who values predictable institutions and is buying into a deep correction, it is the strongest entry the board offers.
Stockholm, squeezed supply behind rent control
Stockholm offers the same governance and a different problem. Sweden’s rent-setting system, the bruksvärdessystemet, sets controlled rents well below market and pushed the average wait for an inner-city apartment to 21 years in 2025, which compresses the income available to investors.
The market revised sharply in 2022 and 2023 as the Riksbank raised rates, with prices just over 12 percent below the 2022 peak. Apartments and houses fell alike, both down 14 percent between early 2022 and early 2023.
Rate cuts through 2025 have supported a modest recovery.
Construction starts collapsed during the downturn, and the recovery is early. Builders started 11 percent more apartments in 2025 than in 2024.
The years of thin building leave a supply deficit that should underpin prices over the medium term.
Sweden is open to foreign buyers, and its property taxes are low, capped at about ten thousand kronor per building for 2026.
Two cost-side features differ from its neighbors. Rental income is taxed more lightly than in the other four capitals, while the krona weakened on trend from 2012 to autumn 2023 and ate into foreign-currency returns.
The krona has since recovered, appreciating about 14 percent against the dollar and 5 percent against the euro during 2025.
Stockholm also has an ownership structure that mirrors Helsinki’s. Most apartments are bostadsrätt units, where the buyer acquires a share in a housing cooperative rather than title to the unit itself.
The association behind that cooperative can take on heavy debt of its own, which feeds straight into monthly fees and resale value. Heavily indebted associations are a well-known trap, and the association’s balance sheet deserves as much scrutiny as the apartment.
For an international investor, Stockholm is a supply-squeeze and capital-preservation case. The deepest free-market rental demand falls on smaller units close to the center.
Reykjavik, the region’s top yield behind an access hurdle
Reykjavik posts the top yield of the five at 4.88% as of the second quarter of 2026, narrowly ahead of Stockholm, helped by tourism demand far ahead of the city’s size. Iceland drew 2.3 million foreign visitors in 2025 against a population of 396,500.
It also tops the 2026 Global Peace Index, and its grid is 99.9% renewable.
Access is the constraint. Under Iceland’s Act No. 19/1966, buyers from outside the European Economic Area (EEA) generally need permission from the Ministry of Justice.
It is granted on two grounds. A close connection to Iceland caps the buyer at one property of no more than three and a half hectares, while a business use that needs more can reach 25 hectares.
EEA nationals face no such hurdle, provided they qualify under the EEA Agreement rather than by passport alone. For everyone else, the approval step adds administrative lead time and a dependency on official discretion.
Two more risks deserve weight. The Icelandic krona has a long history of volatility, a live concern for any investor funding in another currency, and the Reykjanes Peninsula eruption sequence has added a geological risk premium.
International reinsurers now exclude Grindavik, and the Icelandic state has bought out 938 properties there, most of the town, leaving the national catastrophe fund to cover what remains. The hazard assessments reach Svartsengi, Sundhnukur and Grindavik, roughly 40km southwest of the capital, and none of them reaches Reykjavik.
For a buyer who can clear EEA approval and absorb krona risk, Reykjavik pairs the region’s top income with institutional quality that few markets match.
Oslo, an open door onto a weak income case
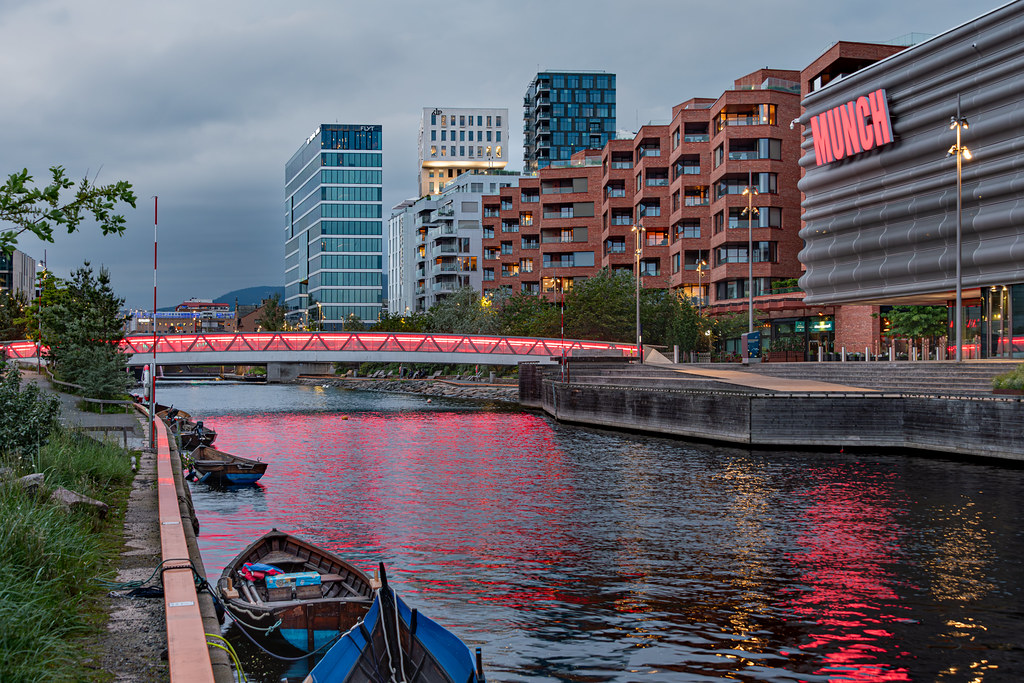
Oslo ranks 78th, fourth of the five, and it is the Scoreboard’s most counterintuitive Nordic result. The macro backdrop is impeccable, anchored by a sovereign wealth fund worth NOK 22,683 billion in mid-2026, and foreign buyers face no nationality restriction, so the door is wide open.
What lets Oslo down is everything behind that door. Gross yields reach 4.50%, and a pro-tenant framework under the Norwegian Tenancy Act limits how far landlords can move rents at renewal, which leaves the income case weak.
The cycle compounds the problem. A decade of strong nominal appreciation leaves the Scoreboard flagging valuation risk rather than upside, the mirror image of the correction that lifts Helsinki.
Currency offers no offset. The krone lost about a quarter of its value against the euro across the decade to 2024, and although it has strengthened through 2025 and 2026, it scores no better on stability than its floating-currency neighbors.
Oslo suits capital preservation rather than yield. Buyers who want clean title, legal certainty, and a market they can enter without permission get all three, while those chasing net income at that level will find it structurally difficult here.
Copenhagen, top livability behind the region’s hardest door
Copenhagen is the most liveable city in the world on the EIU’s 2026 index, for the second year in a row, and it offers the most polished market of the five, with structural undersupply, deep liquidity, and the krone’s peg to the euro removing currency risk for euro-based investors. It lands last of the five all the same, 82nd of 150, for two connected reasons.
One is access. Danish law requires that buyers without permanent residence or five consecutive years of prior residence obtain permission from the Ministry of Justice before purchasing.
That rule reaches further than any other access restriction in the region, catching most non-resident and investment buyers rather than non-EU nationals alone, and it triggers the Scoreboard’s Foreign Ownership Limitations Penalty.
The second reason is after-tax return. Gross yields average 2.87% across the city, and Denmark taxes rental income as personal income, with top-bracket tax adding 7.5% above DKK 777,900.
The market also recovered faster than Sweden or Norway, with owner-occupied apartment prices up 10.7% nationally in 2025 and 14.0% across the capital region, which leaves less of the cyclical upside that Helsinki offers. For a qualified buyer focused on euro stability and long-term ownership in a supply-short capital, Copenhagen rewards patience.
The capital is not always the strongest market at home
The five-capital frame hides the Scoreboard’s most useful Nordic finding. Gothenburg ranks 13th, Bergen 46th, and Aarhus 71st, which puts each of them ahead of its own capital.
In three of the five countries, the capital is not the strongest GPS market at home. Gothenburg is the second most investable Nordic city on the board after Helsinki, ahead of Stockholm by three places.
That result supports the pattern rather than undercutting it. Gothenburg is another corrected, fully open market, which is the same combination that puts Helsinki at the top.
The access question every Nordic buyer hits
None of the five countries offers a golden visa or a residence-by-investment route tied to property, so buying an apartment grants no residence rights anywhere in the region. Access to residence comes instead through work, study, or business.
Where an investor falls on the EU or EEA line also shapes what they can buy. EU and EEA nationals buy freely in Helsinki, Stockholm and Oslo.
Denmark tests residence rather than nationality, so a non-resident EU buyer needs permission for an investment flat like anyone else. Iceland’s exemption depends on qualifying under the EEA Agreement rather than by passport alone.
For non-EU investors who want a foothold, the entrepreneurial routes are the practical path. Finland offers a residence permit for startup entrepreneurs and Sweden has a self-employed residence route, while Norway and Denmark each offer a self-employment or start-up permit.
Iceland has no equivalent, which makes it the most restrictive of the five on this measure.
All of them require that applicants build an active business rather than place capital. Because the Nordic tax base follows residence, anyone weighing these routes should map the consequences of where they become tax resident before committing.
How to read the ranking
The Scoreboard’s Nordic results reward three things in a foreign buyer’s market. They are a market deep in its correction, one a foreigner can enter cleanly, and one where demographic demand is building.
Helsinki tops the global board because it offers all three at once.
Match the city to the goal. Helsinki fits an appreciation play in a market that has revised and remains open to all buyers, Stockholm suits investors betting on a supply squeeze who can wait out thin rent-controlled income, and Reykjavik pairs the region’s top yield with strong governance for those who can clear EEA approval and stomach krona risk.
Oslo is a capital-preservation asset for buyers who do not need income and accept paying up for a market late in its cycle. Copenhagen rewards euro-stable, long-horizon ownership for those who can get through the door.
GPS is a decision-support tool rather than a universal prescription, and the ranking is indicative rather than absolute.
The wider lesson reaches beyond the Nordics. In a region where every market offers world-class institutions, the binding constraints are timing and access, and the data shows they can put one Nordic capital at the top of the board and another at 82nd.