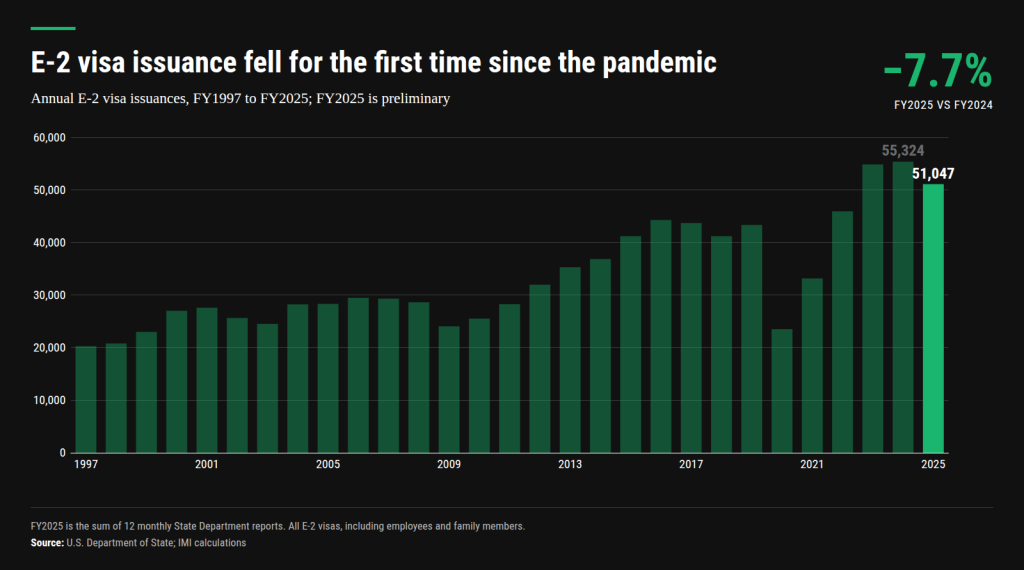
The United States issued 51,047 E-2 treaty investor visas in fiscal 2025, according to IMI’s count of State Department monthly reports. That total is 7.7% below fiscal 2024 and marks the first annual fall since the pandemic year of 2020.
South Korea and Taiwan supplied 54% of E-2 growth between 2019 and 2024, then accounted for 51% of the fiscal 2025 decline. Korean issuance dropped 21% to 5,359, and Taiwanese issuance fell 27% to 2,137.
A Government Accountability Office (GAO) report found that the State Department lost a third of its nonimmigrant visa officers in fiscal 2025.
Canada Passed South Korea for Second Place
Consulates issued 4,277 fewer E-2 visas in fiscal 2025 than in fiscal 2024. Nationals of South Korea and Taiwan received 2,203 fewer.
Canada became the second-largest E-2 nationality, with 6,779 visas, almost the same as its fiscal 2024 total of 6,747. Japan ranked first with 15,367, or 30.1% of all E-2 visas.
Appointment backlogs affect Canadian applicants, according to George Ganey, founding partner of the U.S. immigration firm Ganey Law Group. “Toronto is a good example,” he said in written comments to IMI. “We have seen increasing backlogs for E-2 appointments despite continued strong interest from Canadian investors,” he added.
His firm now handles more Canadian E-2 cases, although its overall intake of new principal investors shows no large increase. Canadian clients cite business opportunities, access to the U.S. market and the rising cost of living at home.
Issuance also shrank in several European markets. British nationals received 2,140 visas, down 21.3%, which put Britain three visas ahead of Taiwan. German issuance fell 16.2% and Italian issuance 18.9%.
France added 232 visas to reach 3,806, and Mexican nationals gained 225, for a total of 1,739.
Taiwan’s Fourfold Climb Ended in 2025
E-2 issuance grew 27.8% between fiscal 2019 and fiscal 2024, when it reached 55,324, a record in the State Department’s finalized nationality tables. Taiwanese issuance more than quadrupled over those five years, from 642 to 2,921, after a jump in fiscal 2022.
South Korea’s total went from 2,554 to 6,778, and Canadian issuance grew by 2,503. Together, the three nationalities supplied 74.8% of the net growth.
Even after the fiscal 2025 fall, Taiwanese nationals received more than three times as many E-2 visas as in 2019.
Refusals Rose 8.8% in the Last Finalized Year
Application and refusal counts for fiscal 2025 have not appeared yet. According to the State Department’s FY2024 workload report, E-2 applications reached 61,432 that year, up 1.7% on fiscal 2023.
Officers ended fiscal 2024 with 6,108 applications refused, 8.8% more than a year earlier. That lifted the refusal share from 9.3% to 9.9%.
Applicants can overcome a refusal after the fiscal year closes. Year-end figures miss those later approvals, so the 9.9% share measures outcomes on the last day of the year.
Visa Officer Numbers Fell From 1,342 to 904
Hiring freezes and attrition cut the number of consular officers who handle nonimmigrant visas by 438 in fiscal 2025, GAO found. Average interview waits for visitor visas reached 201 days that year, against 26 days in fiscal 2019.
“We would be hesitant to attribute the decline in E-2 visa issuances solely to reduced investor demand,” Ganey said. “In our experience, consular appointment availability can have a significant impact on issuance numbers.”
His firm saw no consistent increase in scrutiny of E-2 cases. Appointment availability and processing speed differ more between consulates, he said. The U.S. embassy in Madrid sorts E-2 files into separate categories for new companies, owner renewals and companies with a recent Madrid approval. Under that system, Ganey said, renewals and cases for established E-2 companies move faster.
Some E-2 applicants who are already in the United States can change status through U.S. Citizenship and Immigration Services (USCIS). Those approvals do not appear in State Department visa counts. The published data cannot show how much of the fiscal 2025 fall came from consular capacity and how much from lower demand.
Early Fiscal 2026 Figures Point to a Small Recovery
Consulates issued 20,480 E-2 visas from October 2025 to February 2026, 2.6% more than in the same months a year earlier. That five-month total is 3.8% below the 21,300 issued in the same period of fiscal 2024.
February 2026 brought 4,393 visas, against 3,697 in February 2025. Canadian nationals received 716 that month, up from 318, and South Koreans 676, up from 396.
How IMI Counted Fiscal 2025
IMI added up the 12 monthly reports that the State Department published for October 2024 to September 2025. The department warns that monthly reports are not an accurate basis for fiscal-year totals.
To test the method, IMI applied it to fiscal 2024. For that year, the monthly reports came to 55,385, which is 61 visas above the finalized total. Finalized fiscal 2025 tables had not appeared when IMI checked on November 19, 2026.
Who the Visa Counts Include
Investors receive only part of the E-2 total. Employees and family members also count toward it, and the State Department publishes no figure for the capital behind them. Under USCIS rules, employees must share the investor’s treaty nationality, but spouses and children need not.
Grenadian nationals received six E-2 visas in fiscal 2025, down from 21 in fiscal 2024 and 53 in fiscal 2023. Agents market Grenada’s Citizenship by Investment (CBI) program as a route to E-2 eligibility. The nationality tables do not record how a recipient acquired citizenship.